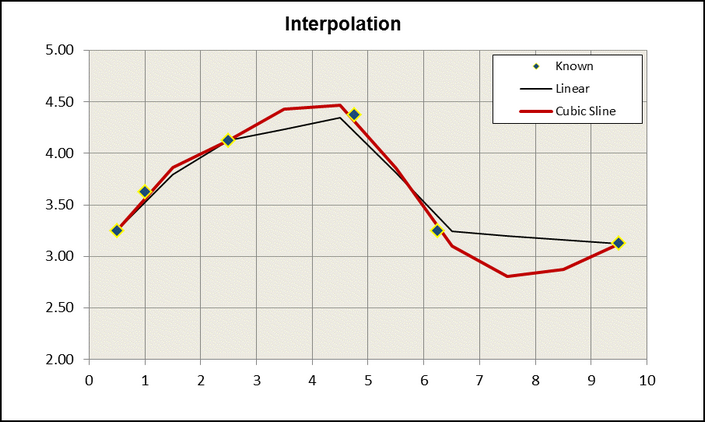
The Interpolation function calculates the linear or cubic-spline interpolated Y value based on a desired X value and a range of known X and Y values. The interpolation function can be used in conjunction with the various option models.
Interpolation |
(InterpolationType, Xrange, Yrange, ValueX) |
Argument |
Description |
InterpolationType |
Alphanumeric value indicating the interpolation type or model: Linear = 0 or "L" (case insensitive) Cubic Spline = 1 or "C" (case insensitive) |
Xrange |
The range of ascending and unique (non-duplicate) known X values. The size of the array, i.e. the number of values within it, must be the same as the Yrange array. |
Yrange |
The range of known Y values, where the size of the array must be the same as the Xrange. |
ValueX |
The input value for the X coordinate whereby a Y value is desired and the return value of the function. |
Example
Example: Linear and Cubic Spline Interpolation Calculate the linear and cubic spline interpolation and graph the results give the following table of known X and Y values at the Desired X values below. So, |
Input |
|
Output |
|||
Known X |
Known Y |
|
Desired X |
Linear Interpolation |
Cubic Spline Interpolation |
0.500 |
3.250 |
|
0.500 |
3.250 |
3.250 |
1.000 |
3.625 |
|
1.500 |
3.792 |
3.865 |
2.500 |
4.125 |
|
2.500 |
4.125 |
4.125 |
4.750 |
4.375 |
|
3.500 |
4.236 |
4.426 |
6.250 |
3.250 |
|
4.500 |
4.347 |
4.464 |
9.500 |
3.125 |
|
5.500 |
3.813 |
3.853 |
|
|
|
6.500 |
3.240 |
3.099 |
|
|
|
7.500 |
3.202 |
2.807 |
|
|
|
8.500 |
3.163 |
2.875 |
|
|
|
9.500 |
3.125 |
3.125 |

For a further example on this model see the included Excel Template located in the root directory of the add-in. This example can be accessed through the Utility Template menu item after the add-in has been installed properly.
A list of all of the possible Error Messages is included for convenience.